The Meraki API Rate Limit, Explained by People Who Hit It 5,000 Times in Two Hours
October 1, 2026
Blog
The Boundless Crew
Every Meraki organization has a shared request budget, and every integration you connect draws from it. When the budget is exhausted you get HTTP 429, and if several clients retry in lockstep the problem feeds itself. This article explains how the limit behaves, two production incidents we caused ourselves, and the design we settled on so that backups, polling and capacity collection can share one organization without starving each other.
How the limit actually works
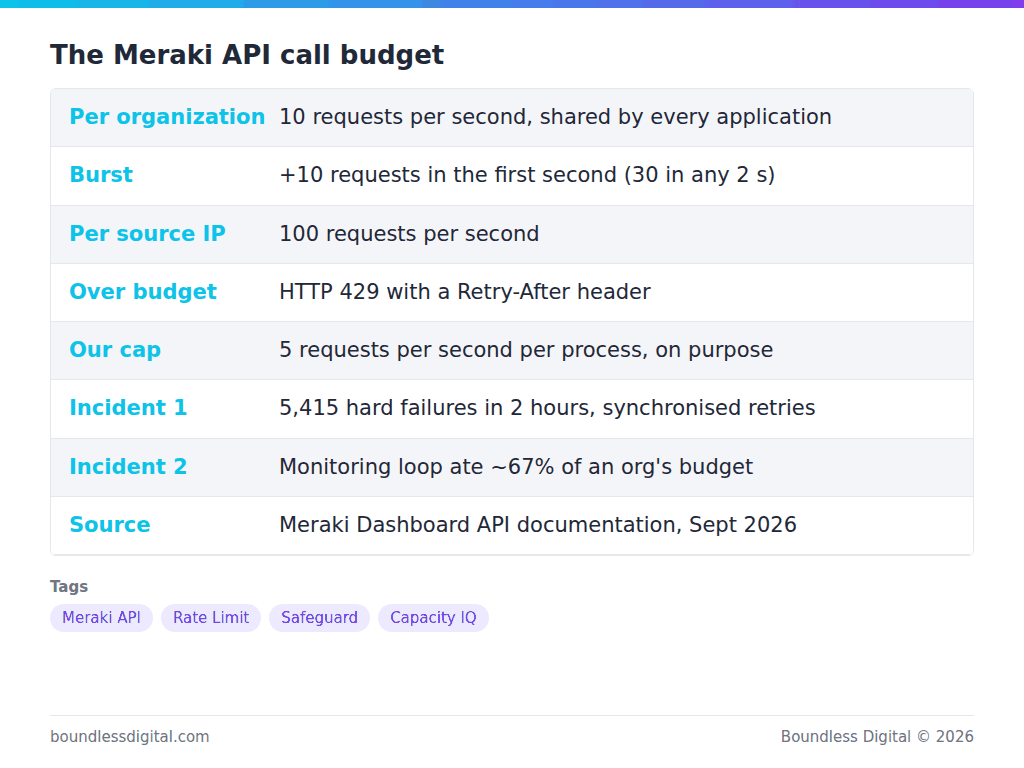
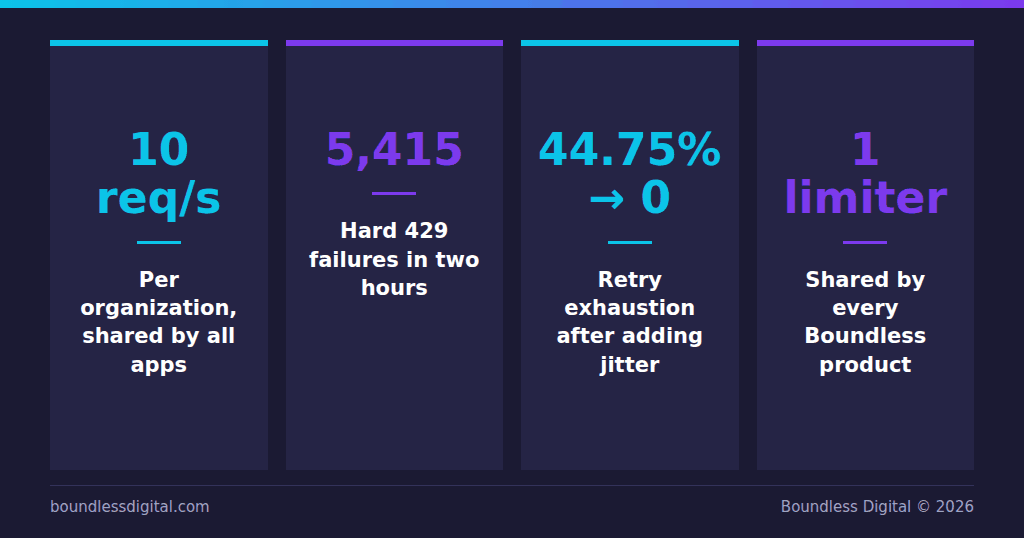
The Meraki dashboard API allows up to 10 requests per second per organization, with a burst allowance of 10 extra requests in the first second, so 30 requests at most in any two seconds. That budget is shared across every API application connected to the organization. There is a separate ceiling of 100 requests per second per source IP address. Exceed either and the API answers 429 with a Retry-After header. (Source: Meraki Dashboard API rate limit documentation.)
The important words are per organization. Not per API key, not per integration. Your backup tool, your monitoring, your ticketing connector and the script an engineer wrote last year all share the same pool. A well-behaved client can be starved by a badly behaved neighbour it has never heard of.
Incident one: the thundering herd
In June 2026 our backups began failing with sustained 429s. Over two hours, 5,415 requests exhausted all 20 retries and failed hard.
The cause was not volume. It was synchronisation. Meraki says “retry after one second”, and our SDK did exactly that, with no jitter. Every process across every environment that hit a 429 woke up at the same one-second boundary and retried together. Each retry round was as crowded as the last. A request could lose that race twenty times in a row.
The fix went into our Meraki SDK: uniform random jitter above the Retry-After floor so retries spread out, attempt-aware escalation so persistent losers wait longer, and a bounded additive-increase, multiplicative-decrease controller so each process slows down on sustained 429s and recovers gradually. In simulation, retry exhaustion went from 44.75 percent to zero. We also capped our own per-process rate at 5 requests per second, half the budget, on purpose.
Incident two: the monitor that ate the budget
Once you can see API usage per organization, you want to refresh it often. Our monitoring read the Meraki request log every minute with unbounded pagination. On a busy organization, one tick could generate hundreds of log-reading calls, each of which became a new log entry for the next tick to read.
On our own development organization that loop consumed roughly two thirds of the API budget. Backups and restores were being starved by the tool meant to protect them.
The fix was to size the sample window to the organization’s observed traffic so that one refresh needs one or two calls, never more, and to flag the sample as truncated when the window has been narrowed. The broader rule: anything that observes API usage must not be a meaningful part of it.
The design we ended up with
One rate limiter per organization, shared by every product. Safeguard backups, change polling, Capacity IQ collection and the health monitor all pass through the same choke point in the SDK. Nothing on the platform can bypass it.
Adaptive rate. The limiter learns from 429s and recovers gradually, the way TCP does. An organization that is quiet gets more headroom; one that is congested gets less.
Congestion detection with hysteresis. Two consecutive congested ticks raise the state; three healthy ticks clear it. This avoids flapping alerts. When an organization is congested, workspace members see a banner explaining why backups may be slow, and it clears itself.
Freeze. An operator can freeze an organization’s traffic entirely from the settings page, for example during a Meraki incident or a competing migration.
Visibility without cost. The Meraki API Settings page shows a request log broken down by integration, operation, admin, source IP and response code. It is served from cache and does not spend the organization’s budget to render.
Dead credentials do not poll forever. After three consecutive unauthorised rejections, polling for that organization pauses. An hourly probe resumes it when access is restored.
What this means for your own scripts
Add jitter to every retry. Retry-After is a floor, not a schedule.
Never paginate an unbounded log on a timer.
Assume you are not alone on the organization. Budget for half of the 10 requests per second the documentation allows.
Before adding a new integration, look at who is already using the API. If your tooling cannot show you that, the first surprise will arrive as a slow backup.
Frequently asked questions
Does Boundless count against my Meraki rate limit? Yes, like every integration. The difference is that all Boundless products share one per-organization limit, adapt to congestion, and cap themselves below the documented budget.
Can I see what else is using the API? The Meraki API Settings page in Boundless breaks down recent requests by integration, admin and source IP for each connected organization.
What happens during a Meraki outage? The limiter backs off on errors. You can also freeze an organization manually and unfreeze it afterwards.
Learn More
Safeguard and Capacity IQ are available on the Cisco Networking App Marketplace and Cisco GPL.
Visit marketplace.cisco.com to see how Boundless can help your network team operate with confidence.