Capacity Planning for Distributed Meraki Estates: A Histogram Beats an Average
October 1, 2026
Blog
The Boundless Crew
Most circuit upgrade decisions in distributed estates are made on complaints and monthly averages, and both are wrong more often than they are right. Minute-level uplink usage, kept as a distribution rather than an average, and judged only during the hours a site is actually open, gives a defensible answer in both directions: which links to upgrade, and which you are overpaying for. This article explains the method Capacity IQ uses and how to apply the thinking even without it.
The problem with averages
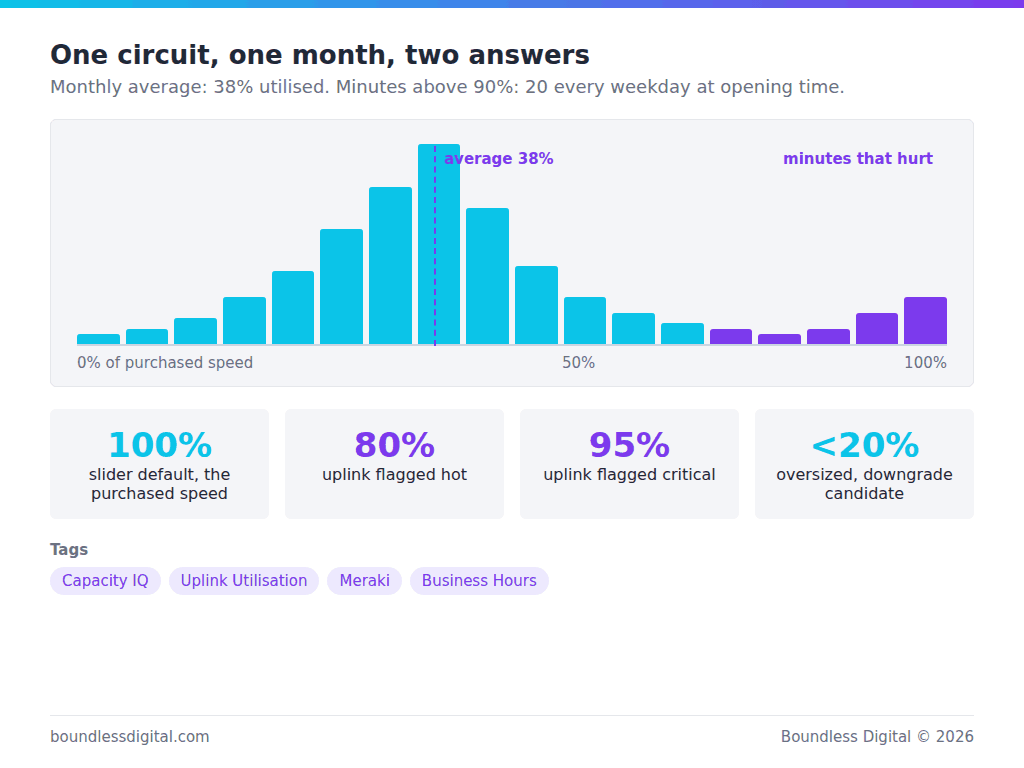
A monthly report says a 200 Mbps circuit averaged 38 percent utilisation. Comfortable. What it does not say is that the link sat at 95 percent for twenty minutes every weekday at opening time, and the point-of-sale system timed out during each of them.
Averages flatten exactly the minutes that matter. Peaks are what customers feel, and peaks are what a monthly average is designed to hide.
The problem with complaints
The other common method is escalation. A site manager complains, the circuit is upgraded, the complaint stops. It works, one site at a time, and it never produces the opposite signal. Nobody calls to say their circuit is too big. Over a few years an estate accumulates dozens of sites paying for a tier they never approach.
What to measure instead
Three changes turn capacity from anecdote into evidence.
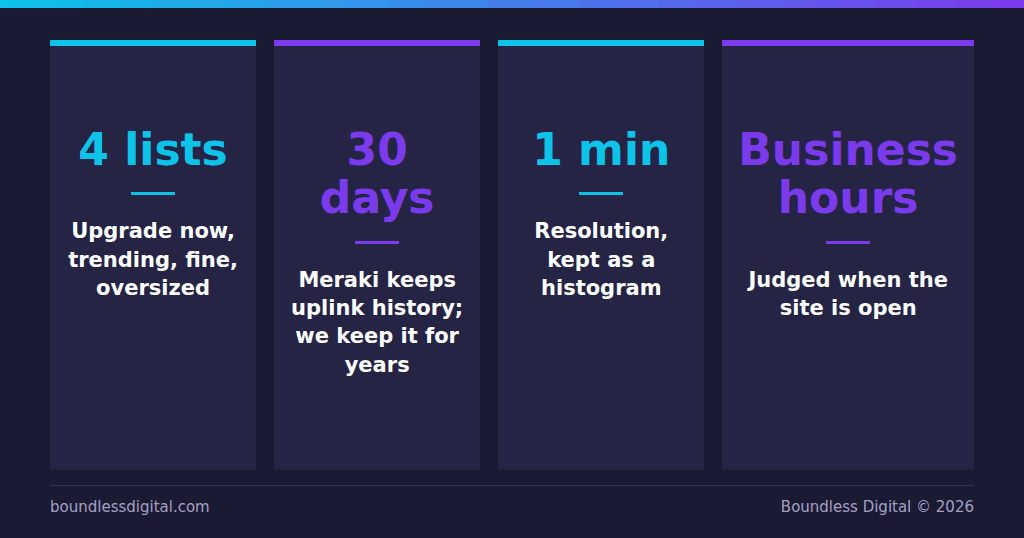
Minute resolution, not five-minute or hourly. Meraki exposes uplink usage at fine granularity, but only for a limited window: the organization-wide uplink usage endpoint looks back a maximum of 30 days, in slices of at most 14 days per request (source: Meraki Dashboard API reference). Collecting it every night and keeping it yourself is the only way to build a year of history, and the only way to see the twenty bad minutes rather than the smoothed hour.
A distribution, not a number. Capacity IQ stores each day’s throughput as a histogram: how many minutes the link spent in each throughput band. From that you can ask real questions. How many minutes above 90 percent? Was the 95th percentile within the purchased speed? Is the high band growing month over month? None of those come out of an average.
Business hours, not the calendar. A link that peaks at 3am during backups is not a capacity problem for the people in the building. Judge utilisation during the hours the site operates, configurable per site, with an all-hours mode for locations that never close, such as distribution centres and hotels.
Four questions, four lists
With those three changes in place, an estate can be sorted into four lists, and each one is a conversation with the carrier.
Links that are already too small: sustained time near the purchased speed during business hours. Upgrade now.
Links trending toward too small: the high band is growing. Budget for next quarter.
Links that are comfortably sized. Leave alone.
Links that are oversized: peaks never approach the purchased tier. Candidates for a downgrade at renewal.
The fourth list is the one nobody has today, and it is where the money is.
Practical details that decide whether this works
You need the purchased speed per circuit, which usually lives in a spreadsheet. Import it; do not retype it. Capacity IQ takes a CSV.
WAN addressing matters for reconciling circuits with carrier invoices. Showing the configured CIDR on static uplinks, not just the bare IP, saves an hour per site during that reconciliation.
Settings change. When you correct a site’s opening hours, the history should be rebuilt under the new hours from archived data, without re-collecting from Meraki. Otherwise your baseline depends on when you first configured the tool.
Collection must be polite to the Meraki API. Nightly, paced through the same rate limiter as everything else, paused automatically when credentials lapse.
Decision rule for an upgrade
If a site keeps spending business-hour minutes above the purchased speed, upgrade. Capacity IQ starts its threshold slider at 100 percent of the contracted speed, the question people ask first, and flags an uplink as hot at 80 percent and critical at 95 percent of purchased speed in its headline cards.
If the site’s busy moments stay below 20 percent of the purchased speed, the level Capacity IQ treats as oversized, for three months, request a downgrade quote.
If the trend line crosses your threshold within two quarters, put it in the budget now.
Frequently asked questions
Does this require any change on the Meraki side? No. Capacity IQ reads uplink usage through the existing connection; it does not configure anything.
How much history do I need before the lists are useful? A full month of business days is enough for the upgrade list. Trend and downgrade decisions are stronger at three months.
Can it tell me which application caused the peak? No. It tells you when and how often the link was saturated, which is the question the carrier contract depends on. Application visibility is a different tool.
Learn More
Capacity IQ is available from Boundless with a free trial. Safeguard and Config Bridge are available on the Cisco Networking App Marketplace and Cisco GPL.
Visit marketplace.cisco.com to see how Boundless can help your network team operate with confidence.